Difference between revisions of "Begins"
From NeuroTychoWiki
| Line 28: | Line 28: | ||
**; Statistics test | **; Statistics test | ||
| − | I used MannWhitney test. Red mark means condition 1 > condition 2 ( p < 0.0001) in signals of this channel. Orange mark means condition 1 > condition 2 (p<0.001). Light blue means condition 2 > condition 1 (p<0.001). Blue means condition 2 > condition 1 (p<0.0001). | + | I used MannWhitney test. |
| + | # Red mark means condition 1 > condition 2 ( p < 0.0001) in signals of this channel. | ||
| + | # Orange mark means condition 1 > condition 2 (p<0.001). | ||
| + | # Light blue means condition 2 > condition 1 (p<0.001). | ||
| + | # Blue means condition 2 > condition 1 (p<0.0001). | ||
*; Guide (in Japanese) | *; Guide (in Japanese) | ||
http://begins.neurotycho.org/guide_jp.pdf | http://begins.neurotycho.org/guide_jp.pdf | ||
Revision as of 16:14, 5 September 2011
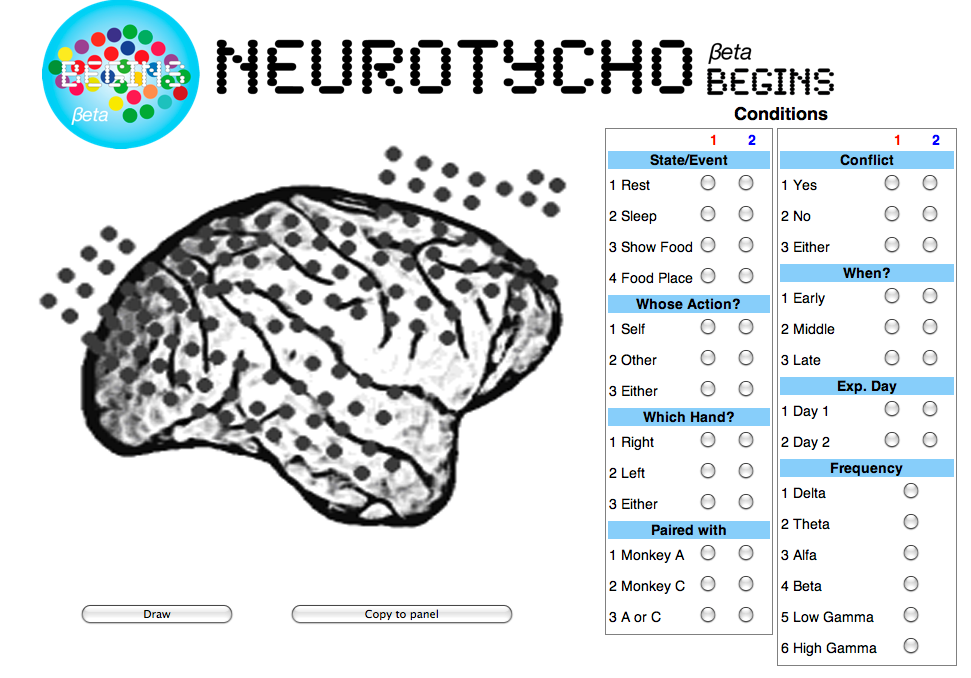
http://begins.neurotycho.org/begins.html (日本語版)
- Data
- 1 Day 1 was uploaded on Neurotycho (http://neurotycho.org/social-competition-task).
- 2 Day 2 was same experiment as Day 1 except "day". ( Day 1 means 2010/08/03, Day 2 means 2010/08/04)
- 1 Sleep was different experiment as social-competition-task. It was anesthesia experiment.
- Analysis
- Time window
- 3 Show food + 1 Early means during start time of show food to monkeys -750 ms and -249 ms.
- 3 Show food + 2 Middle means during start time of show food to monkeys -250 ms and +249 ms.
- 3 Show food + 3 Late means during start time of show food to monkeys +250 ms and +750 ms.
- 4 Food place + 1 Early means during time at putting a food on the table -1000 ms and -501 ms.
- 4 Food place + 2 Middle means during time at putting a food on the table -500 ms and -1 ms.
- 4 Food place + 1 Early means during time at putting a food on the table 0 ms and + 499 ms.
- Frequency
I used FFT to make power spectrum on each time windows.
- 1 Delta means a power spectrum (2 Hz).
- 2 Theta means power spectrum (summation of between 4 Hz and 6 Hz).
- 3 Alpha means power spectrum (summation of during 8 Hz and 12 Hz).
- 4 Beta means power spectrum (summation of during 14 Hz and 28 Hz).
- 5 Low Gamma means power spectrum (summation of during 30 Hz and 58 Hz without 50 Hz).
- 6 High Gamma means power spectrum (summation of during 60 Hz and 100 Hz).
- Statistics test
I used MannWhitney test.
- Red mark means condition 1 > condition 2 ( p < 0.0001) in signals of this channel.
- Orange mark means condition 1 > condition 2 (p<0.001).
- Light blue means condition 2 > condition 1 (p<0.001).
- Blue means condition 2 > condition 1 (p<0.0001).
- Guide (in Japanese)

