Difference between revisions of "Auditory Oddball Scripts"
From NeuroTychoWiki
(Created page with "== Sample script for ERP plots == We assume that we are in the data folder. clear; close all; DataDir=sprintf(['./']); nCH=numel(dir([DataDir 'ECoG_ch*'])); n=whos...") |
(→Preprocessings and ERP plots) |
||
| (2 intermediate revisions by the same user not shown) | |||
| Line 1: | Line 1: | ||
| − | + | We assume that we are in the data folder. | |
| − | + | == Preprocessings and ERP plots == | |
clear; close all; | clear; close all; | ||
| Line 7: | Line 7: | ||
DataDir=sprintf(['./']); | DataDir=sprintf(['./']); | ||
nCH=numel(dir([DataDir 'ECoG_ch*'])); | nCH=numel(dir([DataDir 'ECoG_ch*'])); | ||
| − | n=whos('-file',[DataDir 'ECoG_ch1.mat'] | + | n=whos('-file',[DataDir 'ECoG_ch1.mat']); |
ECoG=zeros(nCH,n.size(2)); | ECoG=zeros(nCH,n.size(2)); | ||
Latest revision as of 16:31, 26 October 2023
We assume that we are in the data folder.
Preprocessings and ERP plots
 clear; close all;

 DataDir=sprintf(['./']);
 nCH=numel(dir([DataDir 'ECoG_ch*']));
 n=whos('-file',[DataDir 'ECoG_ch1.mat']);
 ECoG=zeros(nCH,n.size(2));

 % load data
 load([DataDir 'repEvent']);
 for ch=1:nCH
   openfile=sprintf('ECoG_ch%d',ch);
   ECoG(ch,:)=struct2array(load([DataDir openfile]));
 end
 ECoG=0.25*ECoG;

 % CMR (Common Median Reference)
 mECoG=ECoG-ones(nCH,1)*median(ECoG);

 % bandpass filter with digital filter
 Fs=1000;
 N=100;
 Wn=[1 30]/(Fs/2);
 fil=fir1(N,Wn,'bandpass');
 meth='FIR digital filter';
 fdmdata=filtfilt(fil,1,mECoG')';

 % align on the stimulus onsets
 rtime=(-1100:1000);
 for t=1:length(repEvent)
   fdmrpt(:,t,:)=fdmdata(:,repEvent(t,6)+503*repEvent(t,5)+rtime);
 end

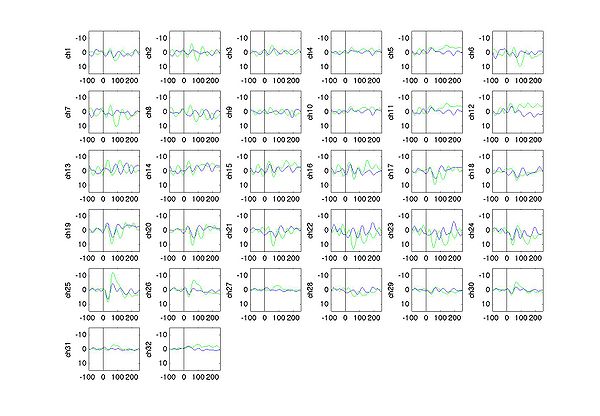
 % plot standard and deviant ERPs
 figure
 for ch=1:nCH
   subplot(6,6,ch-36*(ceil(ch/36)-1));

   % trial rejection
   data=squeeze(fdmrpt(ch,:,:));
   [I K]=find(std(data,[],2)>(mean(std(data,[],2))+3*std(std(data,[],2))));
   trial=[1:size(data,1)]; trial(I)=[];
   data=data(trial,:);

   % cut data
   STD=data(:,rtime>=-603 & rtime<=-3);
   DEV=data(:,rtime>=-100 & rtime<=500);

   % base line correction
   STD=STD-mean(mean(STD(:,1:100)));
   DEV=DEV-mean(mean(DEV(:,1:100)));

   plot(-100:500,mean(STD),'b'); hold on
   plot(-100:500,mean(DEV),'g');
   plot([0 0],[-15 15],'k'); hold off
   set(gca,'XLim',[-100 500],'YLim',[-15 15],'YDir','reverse')
   ylabel(['ch' num2str(ch)])
 end

