Difference between revisions of "EEG-ECoG recording"
From NeuroTychoWiki
m |
(→Oosugi Naoya) |
||
| Line 21: | Line 21: | ||
*;2. Compared EEG prediction rate via ECoG during time-frequency bands | *;2. Compared EEG prediction rate via ECoG during time-frequency bands | ||
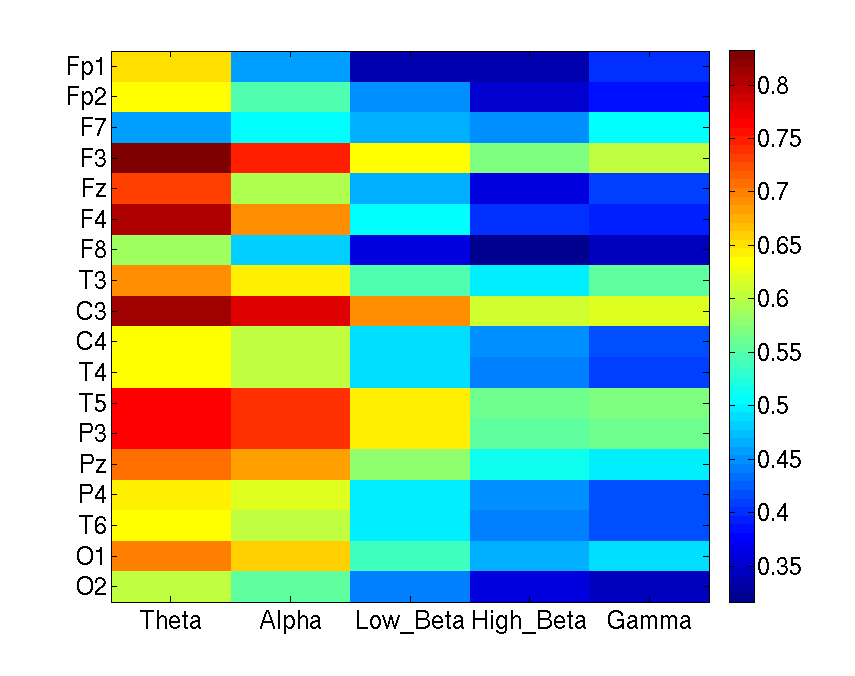
*:EEGs and ECoGs were bandpass-filtered in the time-frequency bands of Theta(between 4 and 7Hz), Alpha(between 8 and 13Hz), low Beta(between 14 and 20Hz), high Beta(between 21 and 30Hz) and Gamma(between 31 and 45Hz). x-axis means time-frequency bands and y-axis means locations of EEG channels. Color bar means prediction rate. This figure shows high frequency components of EEGs are harder to be predicted via ECoGs. | *:EEGs and ECoGs were bandpass-filtered in the time-frequency bands of Theta(between 4 and 7Hz), Alpha(between 8 and 13Hz), low Beta(between 14 and 20Hz), high Beta(between 21 and 30Hz) and Gamma(between 31 and 45Hz). x-axis means time-frequency bands and y-axis means locations of EEG channels. Color bar means prediction rate. This figure shows high frequency components of EEGs are harder to be predicted via ECoGs. | ||
| + | [[File:Theta.png]] | ||
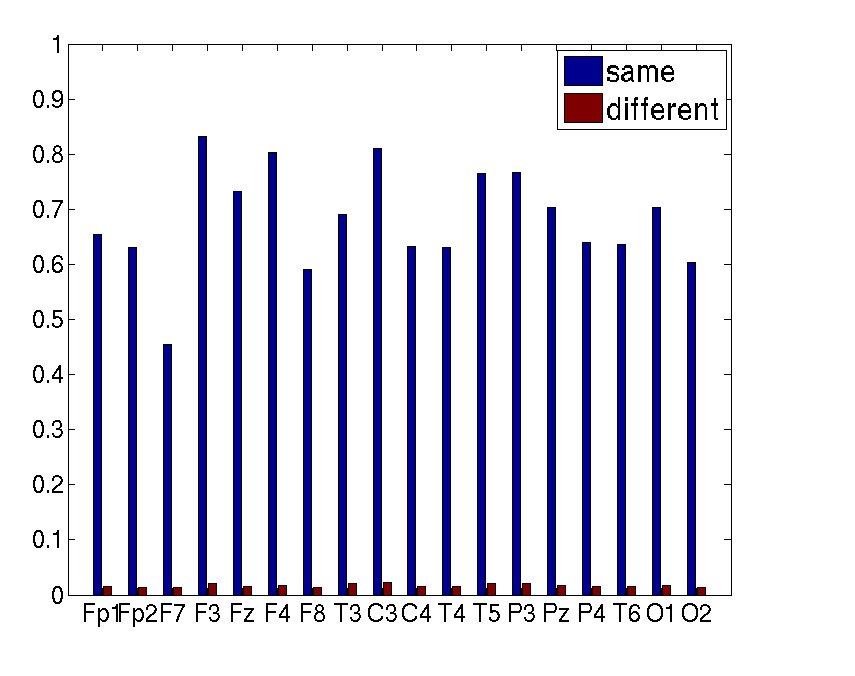
| + | *;3. Prediction rate of EEGs in the frequency band of Theta via ECoGs in the frequency band of Theta or not | ||
| + | *:EEGs in the frequency band of Theta were predicted via ECoGs in the frequency band of Theta and ECoGs without the frequency band of Theta(bandcut-filtered between 4 and 7Hz). x-axis means locations of EEG channels and y-axis means prediction rate. Blue bar means prediction rate of Thete EEGs via Theta ECoGs and red bar means prediction rate of Theta EEGs via EEGs without Theta components. This figure shows the time-frequency band of EEG and ECoG is very similar. | ||
Revision as of 12:23, 27 June 2011
*20110607S2_EEGandECoG_Su_Oosugi+Naoya-Nagasaka+Yasuo-Hasegawa+Naomi_mat_ECoG128-EEG18
Oosugi Naoya
- Processing
- The data were processed in MatLab.
- Band-pass filter
- 4th order butter worth filter(Signal Processing Toolbox)
- Regression
- PCA+Linear regression(Statistics Toolbox)
- PCA was used as whitening.
- Model Estimation
- 4-fold cross validation test
- It did NOT destroy the structure of time-series.
- Prediction rate
- Correlation coefficient between test data and predicted data
- Result
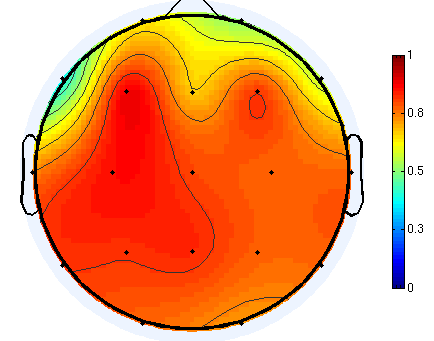
- 1. Plotted EEG prediction rate via ECoG on head map
- EEGs and ECoGs were bandpass-filtered between 1 and 45 Hz. Color bar means prediction rate. Black points means locations of EEG channels(without Cz) but these are not correct because this subject is monkey! This figure shows that all EEG channels can be predicted via ECoG and prediction rate of left EEGs is better than right.
- 2. Compared EEG prediction rate via ECoG during time-frequency bands
- EEGs and ECoGs were bandpass-filtered in the time-frequency bands of Theta(between 4 and 7Hz), Alpha(between 8 and 13Hz), low Beta(between 14 and 20Hz), high Beta(between 21 and 30Hz) and Gamma(between 31 and 45Hz). x-axis means time-frequency bands and y-axis means locations of EEG channels. Color bar means prediction rate. This figure shows high frequency components of EEGs are harder to be predicted via ECoGs.
- 3. Prediction rate of EEGs in the frequency band of Theta via ECoGs in the frequency band of Theta or not
- EEGs in the frequency band of Theta were predicted via ECoGs in the frequency band of Theta and ECoGs without the frequency band of Theta(bandcut-filtered between 4 and 7Hz). x-axis means locations of EEG channels and y-axis means prediction rate. Blue bar means prediction rate of Thete EEGs via Theta ECoGs and red bar means prediction rate of Theta EEGs via EEGs without Theta components. This figure shows the time-frequency band of EEG and ECoG is very similar.


