Difference between revisions of "Manual jp"
From NeuroTychoWiki
| Line 26: | Line 26: | ||
== Scipy == | == Scipy == | ||
| − | + | Scipyはオープンソースのpython用数学、科学、工学のための数値解析モジュールです。 | |
| − | # | + | # http://sourceforge.net/projects/scipy/files/scipy/0.8.0/ から、"scipy-0.8.0-win32-superpack-python2.6.exe" をダウンロード |
## [[File:b5e1b8069c20d716069c8a3eb221b87a.png]] | ## [[File:b5e1b8069c20d716069c8a3eb221b87a.png]] | ||
| − | # | + | # インストーラーを起動 |
| − | ## [[File:55c0bcade8ab3d8a2c51dd08854a2576.png]] | + | ## [[File:55c0bcade8ab3d8a2c51dd08854a2576.png]] アイコンをダブルクリックしてインストーラを起動 |
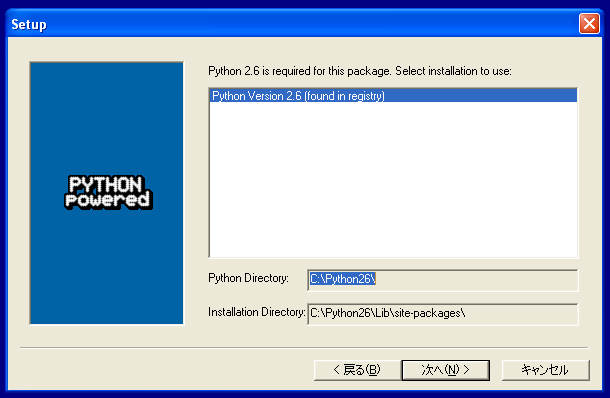
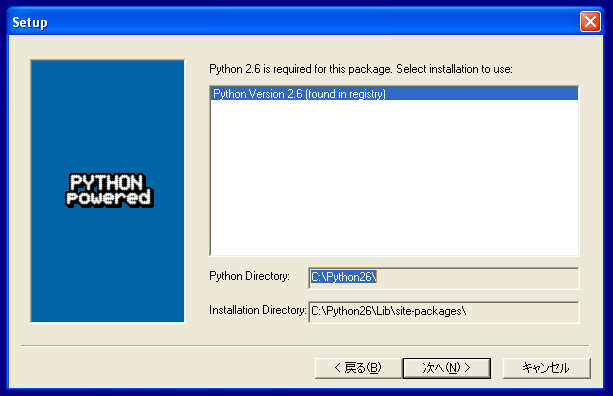
| − | # | + | # インストーラープログラムを以下の手順で進める |
| − | ## | + | ## 特に指定が無い画面については、"Next"ボタンを押して先に進めてください。 |
| − | ## [[File:a2ee9ebb15add7638912245704e55878.png]] | + | ## [[File:a2ee9ebb15add7638912245704e55878.png]] "Python Version 2.6"を選択して"Next"ボタンを押す |
== Matplotlib == | == Matplotlib == | ||
Revision as of 17:28, 28 February 2011
Contents
Windows環境におけるpythonでの解析環境の構築マニュアル
注意:このマニュアルに書いてあるソフトウェアをインストールする際には、パソコンの管理者権限が必要です。また、windowsに関しては32bit版を想定しております。
Python
- http://www.python.org/download/releases/2.6.6/ から、Pythonのバージョン2.6.6の"Windows x86 MSI Installer"をダウンロード
- インストーラーを起動
 アイコンをダブルクリックしてインストーラを起動
- インストーラープログラムを以下の手順で進める
- 特に指定が無い画面については、"Next"ボタンを押して先に進めてください。
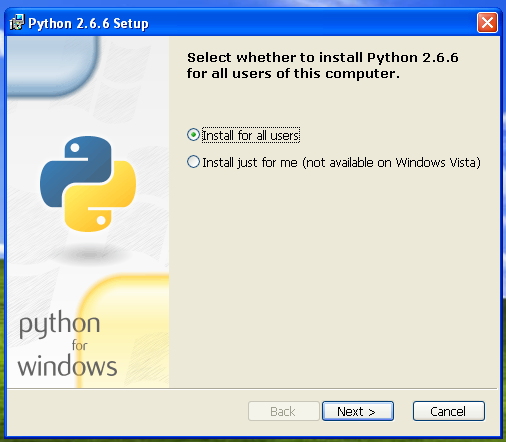 "Install for all users"を選択して、"Next"ボタンを押す
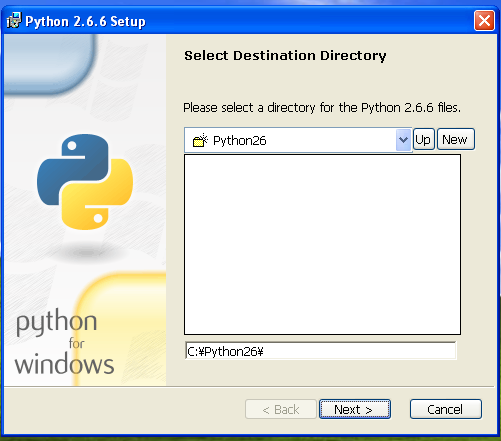 画面に書かれているものから変更せずにそのまま"Next"ボタンを押す
- File:Data/050998d9a57e931e46c2c70119982d27.png "Next"ボタンを押してインストールを開始する


Numpy
Numpyはオープンソースのpython用の数値計算用のライブラリです。
- http://sourceforge.net/projects/numpy/files/NumPy/1.5.1/ から、"numpy-1.5.1-win32-superpack-python2.6.exe"をダウンロード
- File:d9f9e4c26024b18dc4b21b099e7f900d.png]]
- インストーラーを起動
 アイコンをダブルクリックしてインストーラを起動
- インストーラープログラムを以下の手順で進める
- 特に指定が無い画面については、"Next"ボタンを押して先に進めてください。
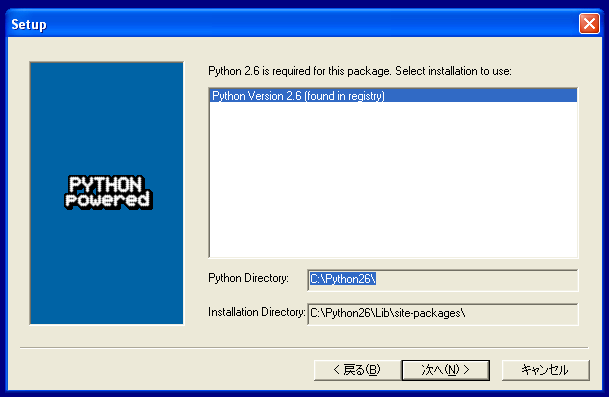 "Python Version 2.6"を選択して"Next"ボタンを押す


Scipy
Scipyはオープンソースのpython用数学、科学、工学のための数値解析モジュールです。
- http://sourceforge.net/projects/scipy/files/scipy/0.8.0/ から、"scipy-0.8.0-win32-superpack-python2.6.exe" をダウンロード
- インストーラーを起動
 アイコンをダブルクリックしてインストーラを起動
- インストーラープログラムを以下の手順で進める
- 特に指定が無い画面については、"Next"ボタンを押して先に進めてください。
 "Python Version 2.6"を選択して"Next"ボタンを押す


Matplotlib
Matplotlib is a plotting library for the Python.
- Visit the official page of matplotlib at http://matplotlib.sourceforge.net/.
- Click on the download link.
- Download "matplotlib-1.0.1.win32-py2.6.exe".
- Run the installer.
 Double click this icon to start installer.
- Step through the installer program.
- Except as otherwise noted, click "Next" to bring forward Installation.
 Choice "Python Version 2.6" and click "Next".


Sample code for analyzing neurotycho data in python
Notice the we assume "C:/neurotycho" as download directory. If You have download neurotycho datasets elsewhere, adapt the pathes below.
plotting
#!/usr/bin/python
#-*- coding: utf-8 -*-
import numpy as np
import scipy.io
import scipy
import matplotlib
import matplotlib.pyplot as plt

_indir = "C:/neurotycho/20100604_S1_ST_K2_ToruYanagawa_mat_ECoG128-Event3/"

def load_mat(path):
    """
    loading a matlab data using scipy.io
    """
    return scipy.io.loadmat(path)

if __name__=="__main__":
    mat = load_mat(_indir+"ECoG_ch1.mat")#loading ECoG data
    data = mat["ECoGData_ch1"][0]
    event = load_mat(_indir+"Event.mat")##loading event data
    eindex = event["EventIndex"][0]#EventIndex is one-row vector contains indexes when events were occurred in ECoG data.
    fig = plt.figure()
    ax = fig.add_subplot(111)
    ax.plot(data)#plotting ECoGdata
    ax.annotate('Inject anesthetic drug',
                xy=(eindex[0],data[eindex[0]]),
                xytext=(eindex[0]-170000,2000),
                arrowprops=dict(facecolor='black', shrink=0.1,),
                )
    plt.show()
result
