File:Begins.png
From NeuroTychoWiki
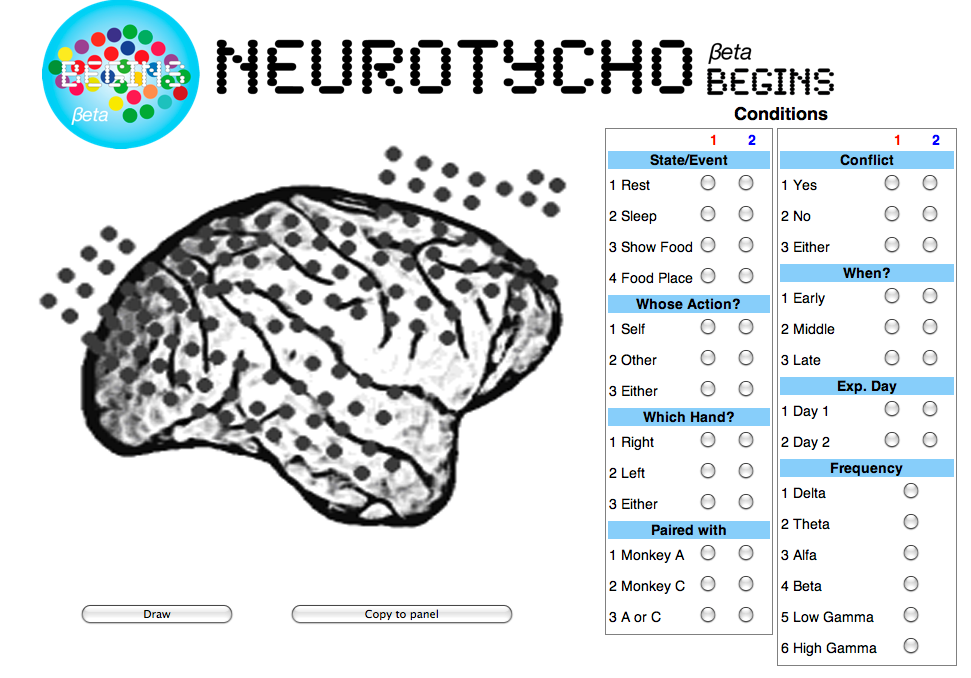
Size of this preview: 800 × 559 pixels. Other resolutions: 320 × 223 pixels | 971 × 678 pixels.
Original file (971 × 678 pixels, file size: 273 KB, MIME type: image/png)
File history
Click on a date/time to view the file as it appeared at that time.
| Date/Time | Thumbnail | Dimensions | User | Comment | |
|---|---|---|---|---|---|
| current | 03:57, 5 September 2011 | | 971 × 678 (273 KB) | Oosugi (talk | contribs) |
File usage
There are no pages that link to this file.